
Can You Spot the Bug? Test Your JavaScript Debugging Skills

JavaScript Debugging is a crucial skill for developers. JavaScript’s power lies in its flexibility, but that same flexibility can sometimes lead to frustrating bugs and unpredictable behavior. Whether you’re a seasoned developer or just starting your coding journey, encountering syntax errors, logic mishaps, or runtime surprises is inevitable. The key to mastering JavaScript isn’t avoiding bugs—it’s knowing how to squash them efficiently. Debugging is more than just fixing mistakes; it’s about understanding how your code behaves, identifying root causes, and refining your problem-solving skills. The better you get at debugging, the more confident and efficient you become as a developer.
Table of Contents
Understanding Common JavaScript Bugs
JavaScript is a dynamic and versatile language, but with great flexibility comes great responsibility. Even experienced developers frequently run into unexpected behavior, often caused by subtle yet tricky bugs. Understanding these common pitfalls can save you hours of frustration and help you write cleaner, more efficient code.
1. Syntax Errors – The First Line of Defense
One of the most immediate and noticeable issues in JavaScript is syntax errors. These occur when the interpreter encounters code it doesn’t understand, such as missing brackets, misplaced commas, or incorrect keywords. Thankfully, modern code editors and linters can catch most syntax errors before you even run your script.
Example:
console.log("Hello, world!) // Missing closing quote
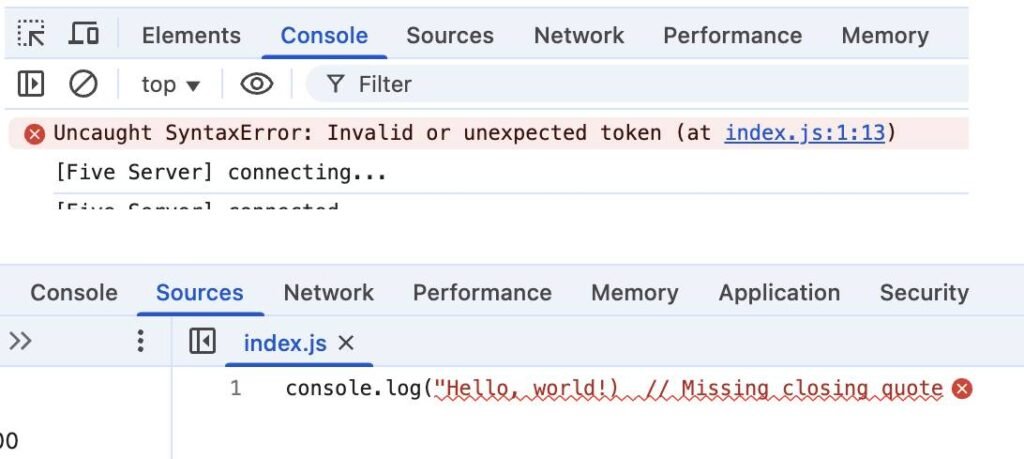
Fix: Always ensure that your syntax follows JavaScript’s rules and leverage tools like ESLint or Prettier to catch mistakes early.
2. Reference Errors – When Variables Go Missing
Reference errors happen when you try to use a variable that hasn’t been declared or is out of scope. This is a common mistake, especially when dealing with block-scoped variables (let and const).
Example:
console.log(userName); // ReferenceError: userName is not defined
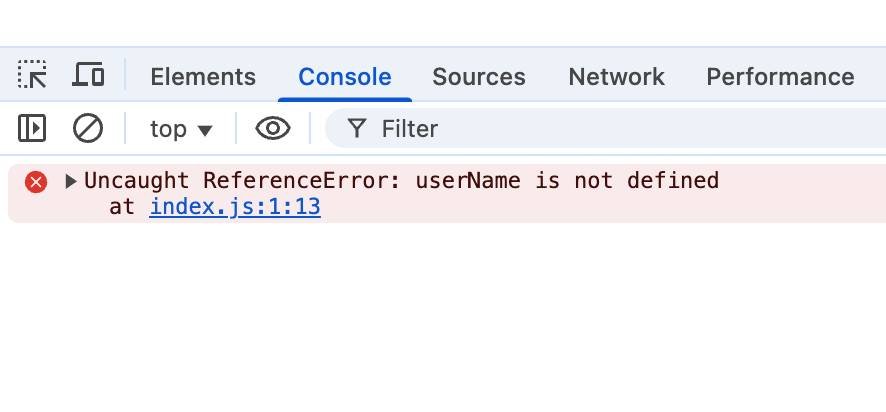
Fix: Always declare variables before using them and be mindful of variable scope in functions and blocks.
3. Type Errors – Mismatched Data Types
JavaScript is dynamically typed, allowing variables to store values of any data type and change types at runtime. However, this flexibility can lead to type-related issues, such as calling a function on undefined or attempting arithmetic on a string.
Example:
let num = "10";
console.log(num.toFixed(2));  // TypeError: num.toFixed is not a function
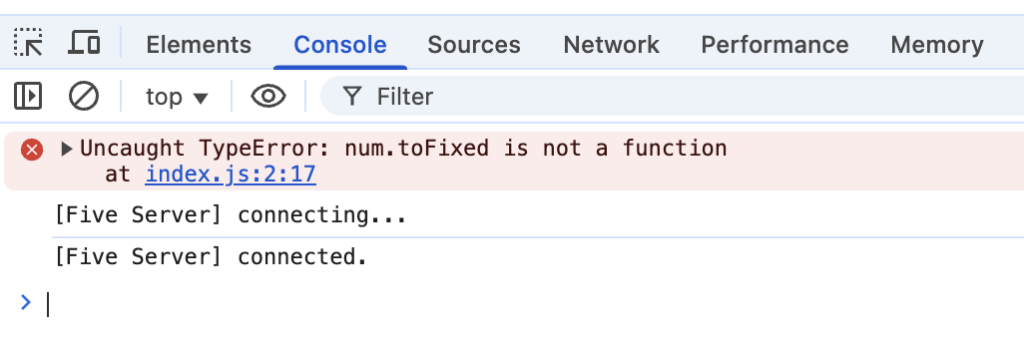
Fix: Use typeof to check variable types and apply proper type conversions where necessary.
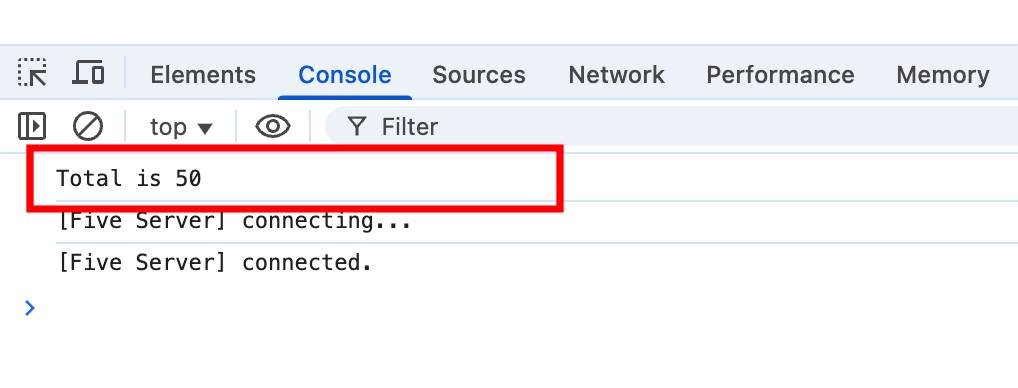
4. Logical Errors – The Silent Bug
Logical errors don’t break your code, but they make it behave incorrectly. These are the hardest to detect because they don’t throw explicit errors. A simple miscalculation or incorrect condition can lead to unexpected results.
Example:
let total = 100;
if (total = 50) {  // Mistakenly using assignment `=` instead of comparison `===`
  console.log("Total is 50");
}
Fix: Always use strict equality (===) for comparisons and carefully test edge cases.
5. Asynchronous Pitfalls – The Callback Confusion
JavaScript’s asynchronous nature can lead to unexpected execution order, especially when dealing with callbacks, promises, and async/await. One common issue is trying to access data before an asynchronous operation completes.
Example:
let data;
fetch("https://api.example.com/data")
  .then(response => response.json())
  .then(result => {
    data = result;
  });
console.log(data);  // Undefined because fetch is asynchronous
Fix: Always handle asynchronous code properly using await or .then() and avoid assuming data is immediately available.
JavaScript Debugging Tools & Techniques
Debugging is both a skill and a strategy, blending analytical thinking with problem-solving creativity. Every JavaScript developer, whether a beginner or a veteran, inevitably encounters bugs that range from simple syntax errors to complex logical mistakes. But here’s the good news—modern debugging tools and techniques make identifying and fixing issues faster and more efficient than ever. Let’s explore some of the most effective tools and approaches to debugging JavaScript like a pro.
1. Browser Developer Tools – Your Javascript Debugging Command Center
Every modern web browser comes equipped with powerful developer tools that help diagnose and resolve JavaScript issues.
Chrome DevTools (or equivalent in Firefox, Edge, Safari)
To open DevTools in Chrome, use F12 or Ctrl + Shift + I (Cmd + Option + I on Mac). Some of the key features include:
Console Tab: View logs, errors, and warnings using console.log(), console.error(), console.warn(), and more.
Sources Tab: Inspect and debug JavaScript files, set breakpoints, and step through code execution.
Network Tab: Monitor API requests, response times, and detect failed calls.
Performance Tab: Analyze memory usage, rendering performance, and JavaScript execution speed.
Tip: Use console.table(data) to visualize arrays and objects in a structured format.
2. Using Breakpoints for Precision Debugging
console.log() is useful, but real javascript debugging requires breakpoints to pause execution at specific lines and inspect the program state.
Setting Breakpoints in Chrome DevTools
- Open the Sources tab.
- Locate your JavaScript file.
- Click on a specific line number to insert a breakpoint and pause code execution.
- Reload the page and the execution will pause at that breakpoint.
Types of Breakpoints:
✔ Line Breakpoints – Pause execution on a specific line.
✔ Conditional Breakpoints – Pause only if a certain condition is met. Right-click on a breakpoint → “Edit breakpoint”.
✔ Event Listener Breakpoints – Pause when a specific event (click, keypress, etc.) is triggered.
Tip: Use “Watch Expressions” in DevTools to monitor variable values live while stepping through the code.
3. The Power of console for Javascript Debugging
The console object provides various logging methods beyond console.log(), which can make debugging more effective:
- console.error(“Error message”) → Highlights an error in red.
- console.warn(“Warning message”) → Displays a warning (useful for deprecations).
- console.table(myArrayOrObject) → Presents structured data as a table.
- console.group(“Label”) / console.groupEnd() → Organizes log output into expandable groups.
- console.time(“TimerLabel”) / console.timeEnd(“TimerLabel”) → Measures execution time.
Tip: Use debugger; in your JavaScript code to trigger an automatic pause in DevTools (if DevTools is open).
4. Source Maps – Debugging Minified Code
In production, JavaScript is often minified for performance, making it nearly impossible to debug. Source maps allow you to trace errors back to the original source code.
How to Enable Source Maps:
- Ensure your JavaScript build tool (Webpack, Babel, etc.) generates source maps (
devtool: "source-map"in Webpack). - Check if your DevTools has “Enable JavaScript source maps” activated in Settings → Sources.
- Debug directly in the mapped, readable code instead of the minified bundle.
Tip: If you’re debugging a third-party library, check if the library provides source maps for easier troubleshooting.
5. Debugging Asynchronous Code
JavaScript’s asynchronous behavior—callbacks, promises, and async/await—can make debugging tricky.
Debugging Promises
✔ Use .catch(console.error) to catch errors in promises.
✔ Use Promise.allSettled() to track multiple async operations without failing fast.
Debugging async/await
✔ Wrap await calls in try...catch blocks to handle errors properly.
✔ Use “Async Stack Traces” in Chrome DevTools (Sources → Call Stack) to track async execution.
Tip: Use console.trace() inside an async function to print a stack trace for better debugging context.
6. Remote Debugging – Fixing Bugs on Mobile Devices
Debugging on a desktop browser is straightforward, but what about mobile debugging?
Chrome Remote Debugging for Android:
- Connect your Android device via USB.
- Enable Developer Mode & USB Debugging.
- Open Chrome on your desktop → Visit
chrome://inspect. - Select your connected device and start debugging live.
Safari Remote Debugging for iOS:
- Enable Developer Mode on your iPhone/iPad.
- Open Safari on your Mac → Go to Develop → Select your device for inspection.
Tip: For testing across multiple devices, use browser-sync tools like BrowserStack or Lighthouse for performance audits.
7. Automated Debugging & Error Monitoring
For large-scale applications, manual debugging isn’t always practical. Automated tools help catch and log errors in production.
Popular JavaScript Error Monitoring Tools:
✔ Sentry – Captures runtime errors with stack traces.
✔ LogRocket – Provides session replays for tracking user behavior and bugs.
✔ Raygun – Monitors errors and performance metrics in real-time.
Tip: Always integrate proper logging (try...catch with logging tools) in production apps to catch unexpected issues.
FAQ
Q1: What are some effective strategies to enhance JavaScript debugging skills?
To improve your JavaScript debugging skills, regularly practice identifying and fixing errors in code. Utilize browser developer tools to set breakpoints and inspect variables, and engage in coding challenges that focus on debugging scenarios.
Q2: How can I simulate common JavaScript errors for practice?
A: You can create practice scenarios by intentionally introducing errors into your code, such as syntax errors, type mismatches, or logical flaws. Additionally, exploring open-source projects and attempting to fix existing issues can provide real-world debugging experience.
Q3: Are there tools specifically designed to test and improve JavaScript debugging skills?
A: Yes, platforms like JSFiddle, CodePen, and LeetCode offer environments where you can practice coding and debugging. Some websites provide interactive debugging challenges that simulate real-world problems, helping you enhance your skills.
Q4: How does understanding common JavaScript pitfalls aid in debugging?
A: Familiarity with common JavaScript pitfalls, such as hoisting issues, scope misunderstandings, and asynchronous behavior, enables you to anticipate potential errors. This knowledge allows for quicker identification and resolution of bugs during the debugging process.
Conclusion
JavaScript Debugging is an essential skill that every developer must master. While JavaScript’s flexibility makes it powerful, it can also lead to unexpected bugs and tricky issues. Whether you’re a beginner or an experienced coder, encountering syntax errors, logical flaws, or runtime problems is part of the journey. The key to becoming proficient in JavaScript isn’t about avoiding bugs altogether—it’s about developing the ability to diagnose and fix them efficiently. Debugging is more than just correcting mistakes; it’s about understanding how your code functions, identifying root causes, and improving your overall problem-solving approach. The more skilled you become at debugging, the more confident and productive you’ll be as a developer.
Bugs are an unavoidable part of programming, but recognizing these common JavaScript errors can help you predict and prevent them. Effective debugging isn’t just about resolving issues—it’s about learning from them. Writing clean, structured code and using the right debugging tools can make your applications more stable and easier to maintain.
Mastering debugging techniques separates good developers from great ones. The most effective approach goes beyond just fixing bugs; it involves understanding their root causes and implementing strategies to prevent them in the future.
 Install jsUpskills app on your home screen!